
Step-by-Step Guide for Marketing Report Automation using s.i.m.b.a and Google Looker Studio
- Nguyen Huynh
- July 2, 2024
- Walkthrough
- 0 Comments
Simba allows you to connect your data sources from various platforms and report on them using visualization tools like Google Looker Studio. Follow these steps to create a s.i.m.b.a Google Looker Studio Connector.
This guide walks you through the basic steps of Looker Studio configuration for all of our data source connectors. However if you would like more details on a specific connector, you can jump to our video guides for some of our most popular connectors in Looker Studio
Step 1: Register a Looker Studio Account

Go to Looker Studio: Open your web browser and navigate to Looker Studio.
Click “Use It For Free”: In the main banner click the blue button “Use It For Free”.
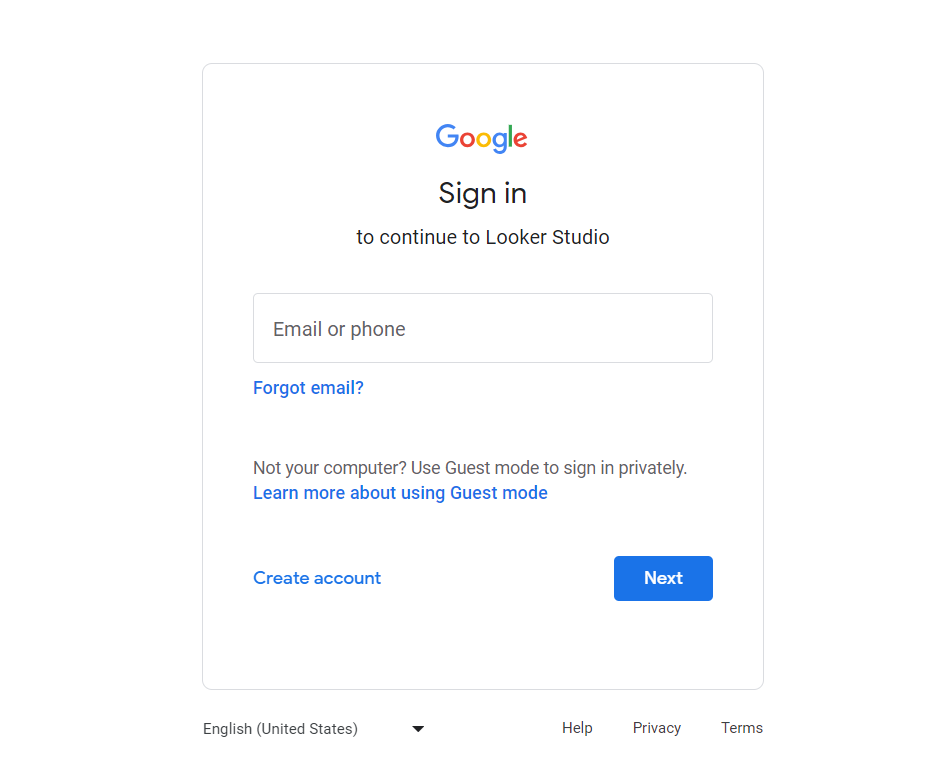
Register or Login with your Google Account: Choose the Google Account you want to use for your Looker Studio reports and enter your password
If you are registering for the first time you may be prompted to give feedback about your Google Account click “Not Now” to skip it.
Step 2: Add a Data Source
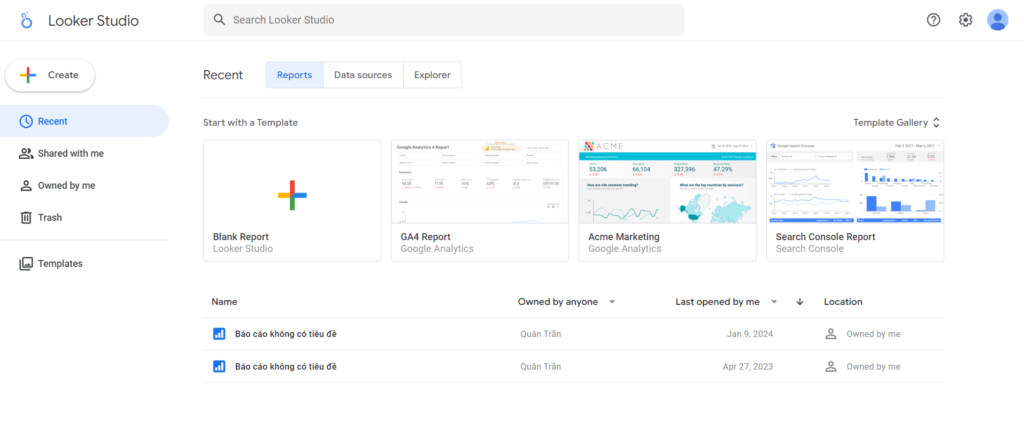
Create a Data Source: Click on the “+ Create” button and select “Data Source”.
If you are using Looker Studio for the first time, you will see a pop up to complete your Basic Details. Select your country, add your company name, and agree to the T&Cs. Once completed click “Continue”.
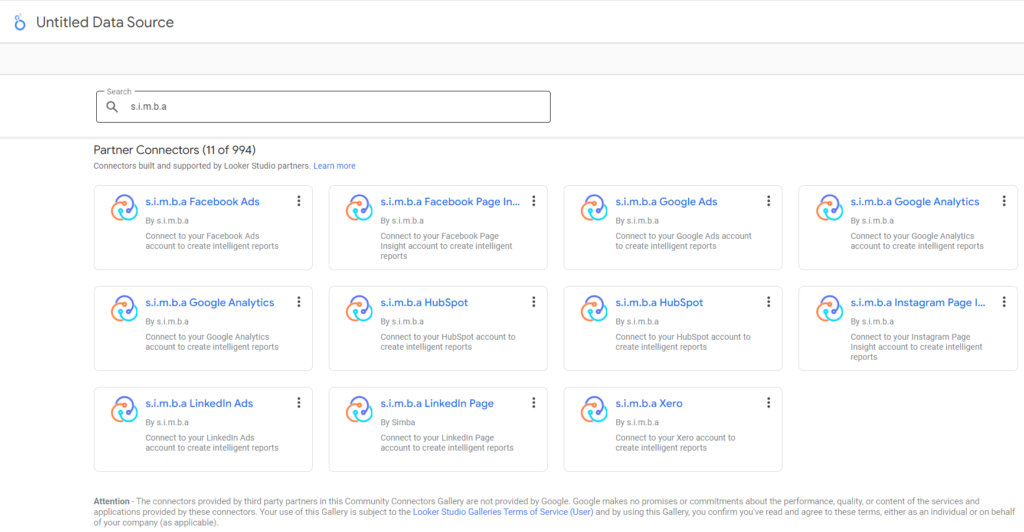
Search for “simba”: In the search bar, type “simba” and press enter.
Select the Platform: Click on the platform you want to connect to.
Step 3: Authorise s.i.m.b.a
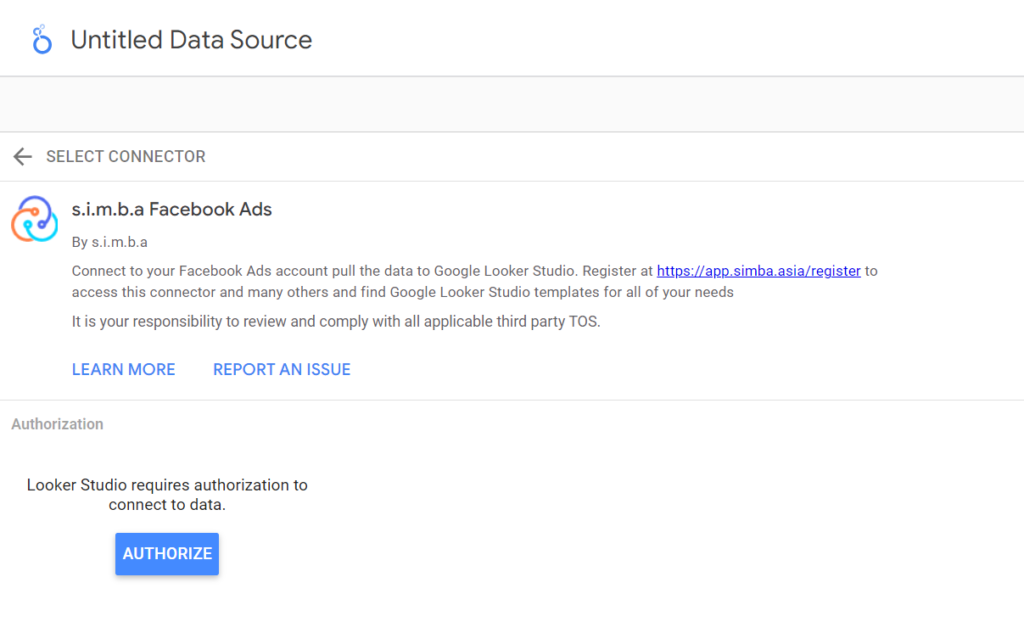
Authorise s.i.m.b.a to Connect to Google Account: You will be prompted to authorise s.i.m.b.a to connect to your Google account. Click “Authorize”.
Follow the steps of the Google authentication and grant s.i.m.ba access to your email and basic profile information. This process will create a new account or link to an existing account you have previously set up on s.i.m.b.a. If you do not have an account you will be automatically signed up to a free trial
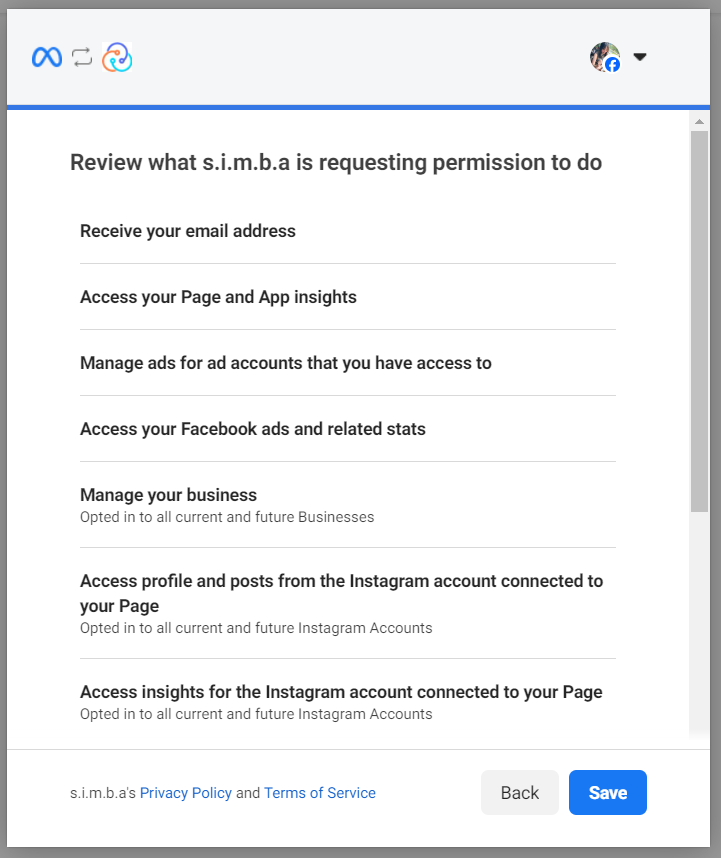
Authorise the Data Platform: Authorise s.i.m.b.a to access the platform from which you want to pull data.
If you are logged in to your platform account in the same browser, the platform may not ask for your username and password, however in many cases the platform will also ask for the 2 factor authentication you have created even if you are logged in on the same browser. (Please note that s.i.m.b.a will never get access to your login credentials. The platform you want to connect to is verifying that you would like to link s.i.m.b.a to your account so that we can visualise your platform data)
The platform will take you through the steps of choosing and granting access to the data you want to visualise.
After authorising the platform the window will close and bring you back to Looker Studio
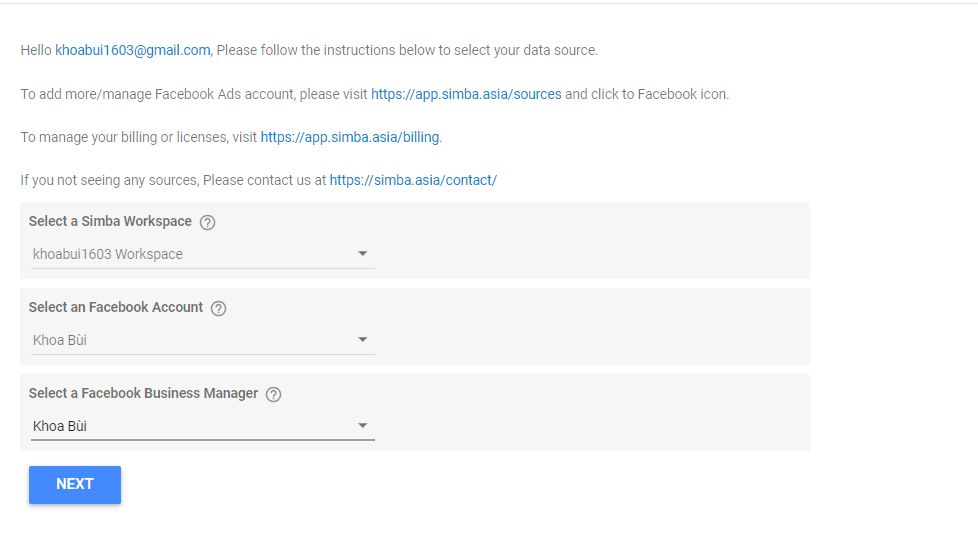
Step 4: Configure your Data source
Select the Account: Choose the account associated with the platform you authorised. (You may have many workspaces inside the platform linked to your email address)
Select the Workspace: With some connectors you may have other workspaces on the platform such as different clients, ad accounts or projects that you want to visualise, use this part of the configuration to choose what source you want to connect to your report.
Click Connect: Once the account and workspaces have been selected, click “Connect”.
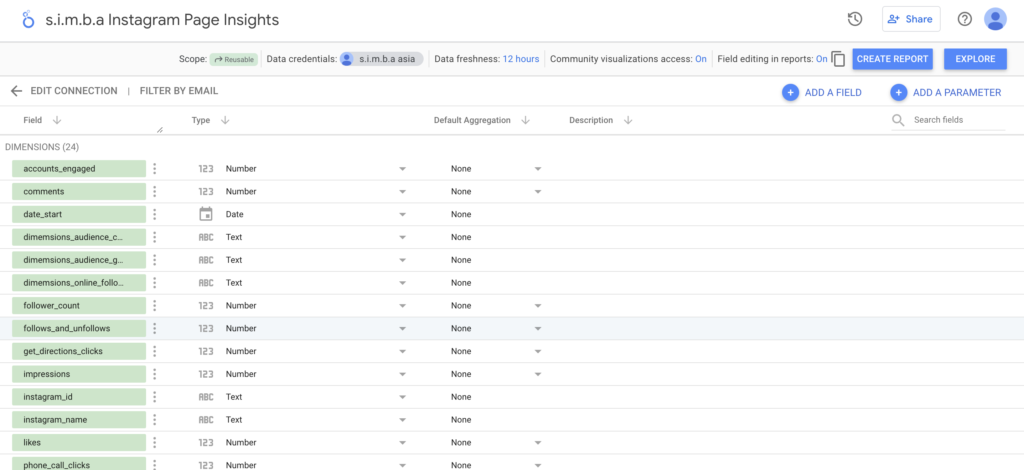
Step 5: Explore and Add Data Source
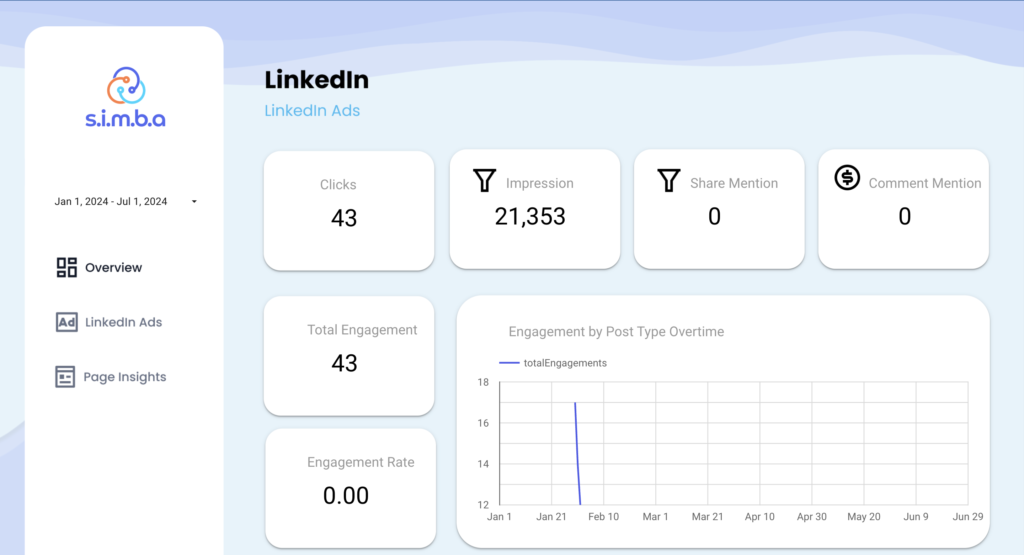
Explore the Data: The data sources are now added. You can explore the data in Looker Studio’s data explorer. And use this data in a custom report or one of our prebuilt templates. The data source will be saved to your Data sources in Looker Studio
Step 6: Create a Report
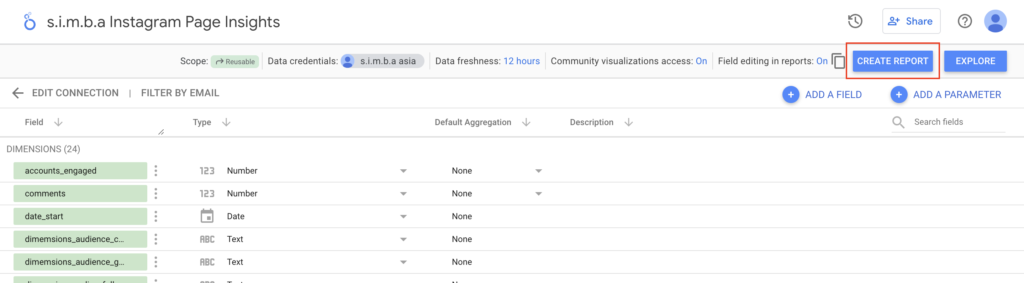
Click “Create Report”: On the top right of the Data Sources preview screen click “Create Report”
Make a new Report: A dialogue box will pop up, informing you that you are about to create a new report. Click “Create Report”
Report has been added: A new tab has opened up and has saved your new report to your reports section in Looker studio
s.i.m.b.a processing: It will take some time for s.i.m.b.a to collect the backfill of your historical data. Depending on the platform this can be available in minutes or up to an hour. This backfill of data makes it easy for you to make historical comparisons. If your report is showing no data, fear not just pop back in a little while and you will see your data populated, this backfill only happens once and after it has been completed you will see your platform metrics updated in near real time.
Related Posts

- Nguyen Huynh
- February 4, 2024
Connecting s.i.m.b.a to Looker Studio
Select the report you want to add your data source to. Then click ‘Add Data’ 2. A w ..

- Nguyen Huynh
- January 31, 2024
Never used Looker Studio? Register an account on Looker studio.
Follow these steps to register an account on Looker Studio, If you don’t already have one. 1. ..

Leave A Comment
You must be logged in to post a comment.